
Calculating and Improving Your Twitter Click-through-Rate
The author's views are entirely their own (excluding the unlikely event of hypnosis) and may not always reflect the views of Moz.
As marketers, many of us leverage Twitter as a direct traffic tool - sharing URLs via the service to encourage clicks and visits to help increase awareness, branding and possibly drive some direct actions (singups, sales, subscriptions, etc). But, from what I've seen and experienced, not many of us spend time thinking about how or taking action to improve the CTR we get from the links we tweet.
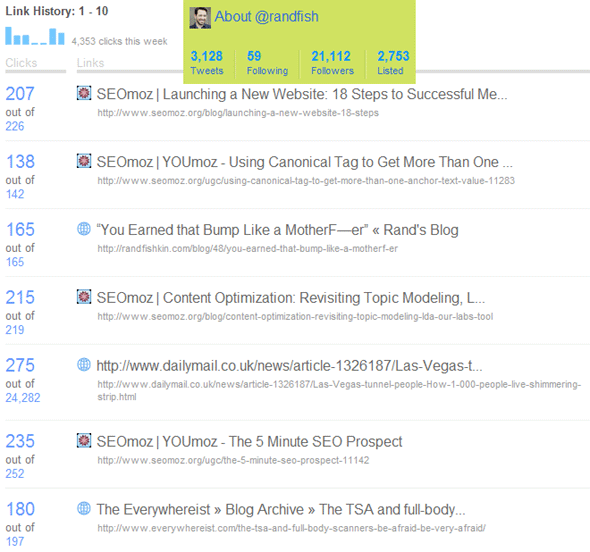
Given that I have 21K+ followers, but most of the links I tweet generate 150-250 clicks, my CTR is only averaging 1.34%
As analytics junkies, we're well aware that we can only improve things that we measure, analyze and test. So let's look at a process for measuring our tweets, analyzing the data and testing our hypotheses about bettering our click-through-rates. If we do it right, we could increase the value Twitter brings us as a marketing and traffic channel.
First off, we're going to need some data sets that include each of the following:
- Profile Data
- # of followers
- # of following
- # of tweets
- # of tweets on avg per day
- Tweet Data (only on tweets containing a unique, trackable URL - e.g. bit.ly/j.mp)
- # of clicks
- # of retweets
- time of day
- tweet structure (e.g. text, url, text VS url, text VS text, url VS text, url, hashes)
This can be time consuming to grab, but if you know how to use Twitter & Bit.ly's APIs, you could make a more automated system to monitor this. Once you've assembled these, you'll want to build a spreadsheet something like this:
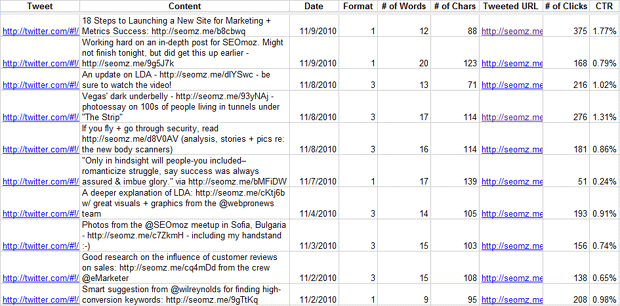
I've made the version I created for my own stats public here on Google Docs to help provide an example. With the help of my Twitter history page and the bit.ly+ system (which allows anyone to see the click stats on any unprotected bit.ly link) I constructed a chart of my last 25 tweets containing URLs where I had personally created the bit.ly link (retweets and tweets where I used links from others would be noisy and unusable for this particular purpose).
Using this data, I can ask some interesting questions and learn the answer, including:
Do My Wordier Tweets Earn Higher CTR?
To answer, we merely need to look at the number of words per tweet compared against CTR. We can then build a graph to visually illustrate the data.
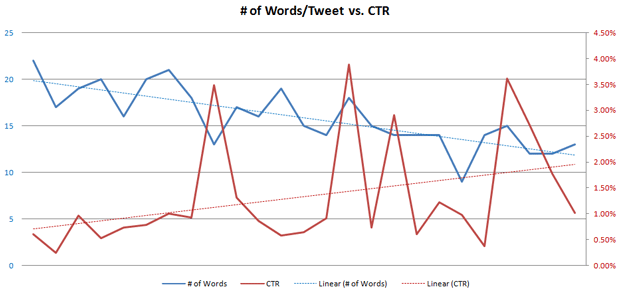
The trendlines (in dashes) are showing me that there's a slight pattern, and Excel's correlation function returns a value of -0.262, suggesting that there's a very subtle correlation between shorter tweets and more clicks. I might try testing this in the future with particularly short tweets, since my average word length is 15.88 with a standard deviation of only 3.88 (meaning most of my tweets are consistently lengthy).
Do My Shorter Tweets Perform Better?
Let's try asking a similar question as above, but look at the raw length of the tweet. According to Hubspot's data (as presented by Dan Zarrella), shorter tweets are more likely to be retweeted, so perhaps a simliar relationship exists for CTR.
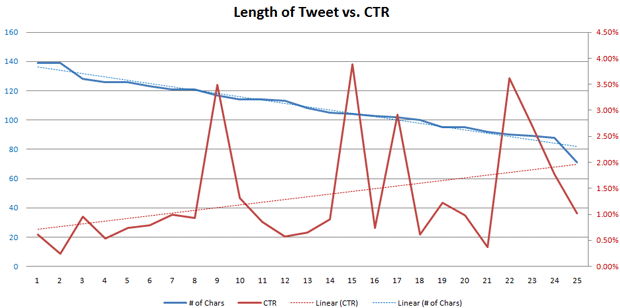
The results are similar, but a little stronger here. The correlation is -0.335, again suggesting shorter tweets might be getting higher CTRs. My average tweet is 108.92 characters in length (standard deviation of 16.94). Given this datapoint and the above, I'm certainly tempted to try a bit more brevity in my tweets.
Do On/Off Topic Tweets Affect My CTR?
In order to find out whether the topic focus of my tweets has an impact on the click-through-rate, I had to create a numerical value mapped to the degree of "on-topicness," then assign that to each URL. Since I'm in the SEO field, my profile says I'm going to be tweeting about SEO, startups and technology and the majority of my tweets are on these subjects, I decided on a scale like this:
- 0 - On a completely unrelated topic
- 1 - On a topic subtly related to marketing/technology/startups/SEO
- 2 - About tech, marketing or startup subjects, or pseudo-on-topic for SEO
- 3 - Specifically about SEO
I then made the following chart representing this data next to CTR:
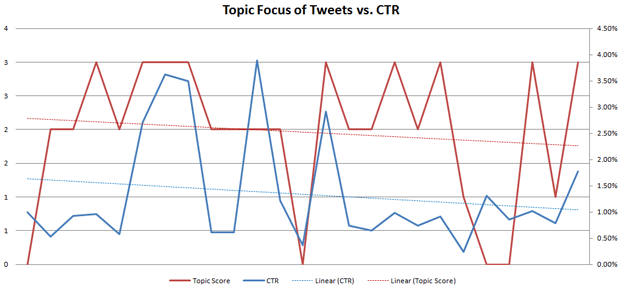
The correlation function suggests this is a bit higher: 0.43, suggesting that when I tweet about the topics people expect to hear from me about, a higher percentage of them click those links. That's not unexpected - in fact, I would have predicted a higher correlation (and who knows, across a larger dataset, it might have been stronger).
Is My CTR Improving Over Time?
This is a pretty simple one to answer.
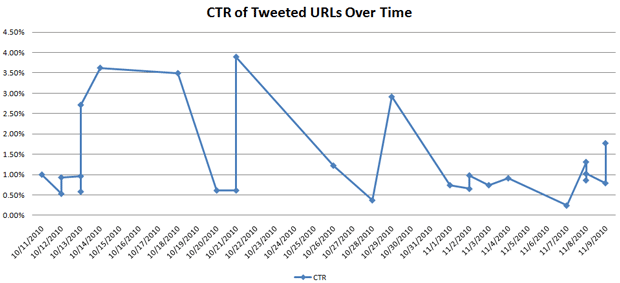
Sadly, that answer is no. I hit my peak in early October with a few choice tweets and haven't had much in the high ranges since that time. This is a good lesson in why it's important for me to be monitoring, testing and working to improve, as I'm clearly not doing that through meer experience.
On a broader scale, we also recently conducted some research analyzing 20+ different Twitter accounts and hundreds of tweeted URLs from them. You can see the raw dataset here looking at ~250 tweeted URLs with CTR data, and several metrics about each of the accounts tweeting them. Our hope was to see whether any of the metrics could help predict a higher vs. lower CTR.
The following chart illustrates our findings:
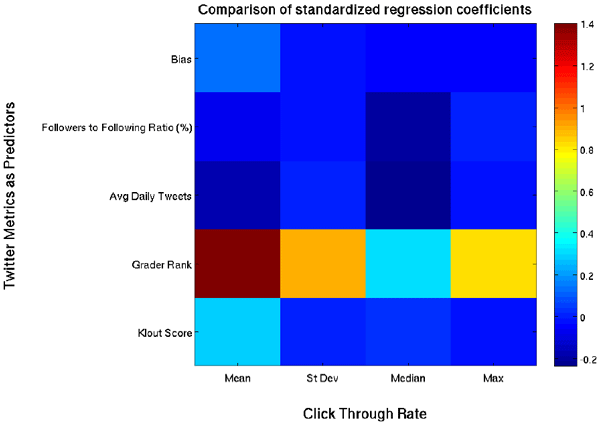
Basically, no single metric about an individual's Twitter accout was particularly predictive of higher CTR with the exception of TwitterGrader Rank. However, in this case, a higher numeric rank (meaning a "worse" rank) had a higher corrrelation, suggesting the relationship is awkwardly inverse. We were also bummed to see that Klout scores, which we'd hoped would be predictive of CTR, were barely correlated.
One interesting thing we found - average CTR across all 250+ tweets to be only 1.17% (0.024 standard deviation). Thus, I shouldn't feel too bad about my 1.34% average CTR.
The research, unfortunately, didn't lead us to any great conclusions, but we are planning to revisit the problem again in the future with larger datasets and more variables. For now, you can download the full report here. Feel free to share, but please do attribute to SEOmoz if/when you do.
While these types of analysis can be interesting, it's not a scalable or practical solution for most marketers. What we need is a tool that can automatically analyze our Twitter accounts, collect more and better metrics, and run over them in an automated fashion. That tool doesn't exist today, but someone should really build a "Twitter Optimizer." If you've got the skills and are feeling up to it, but need financial remuneration, SEOmoz would be happy to contract to have that built - just drop me a line (rand at seomoz dot org).
p.s. Special thanks to Ray Illian for compiling the research and the report above.


Comments
Please keep your comments TAGFEE by following the community etiquette
Comments are closed. Got a burning question? Head to our Q&A section to start a new conversation.