

How to Leverage Year Over Year Data Successfully
The author's views are entirely their own (excluding the unlikely event of hypnosis) and may not always reflect the views of Moz.
Oh the New Year. How we love you so. There are so many reasons to love you. Let us count the ways:
- Those "Best of 2010" blog posts finally come to an end.
- We all have a great reason to buy more stuff than we need because the entire world is on sale.
- Everyone's energy is sky high. It's incredibly contagious. YES! LET'S DO THIS! WORLD DOMINATION!
- Rarely does a New Year start without popping a bottle (or four) of champagne, which you all know is a favorite pastime of us Mozzers.
- We can all get excited as we start baby stepping toward the summer, which means sunshine in Seattle is officially less than 1/2 a year away. Not that we are counting down or anything.
On top of all those excellent reasons I'd like to add my favorite part about the coming of a new year to the mix--it's time to explore your Year Over Year (YOY) data! Did you all just freak out like me? Yeah I thought so.
What makes YOY data so valuable?
YOY data is one of the few datasets that both offers a micro and macro view of your site's performance in one sitting. Throughout the year we work off mini-data segments (today compared to yesterday, week over week, month over month, etc.) and it is challenging to see outside influences. It is incredibly difficult to make valid conclusions off of data that exists in a vacuum. YOY analysis allows us the rare chance to compare large datasets side to side with similar outside factors already accounted for.
We can compare data and isolate out things like; year over year trends, year over year differences, anomalies that don't follow the grain, and so much more. In my opinion, all analysts should take a few hours in the next few weeks and just wander around their YOY analytics. Pull your performance reports, pull your traffic data, pull everything you can from 2009, and then pull it all for 2010. Put them side-by-side and then jump in there.
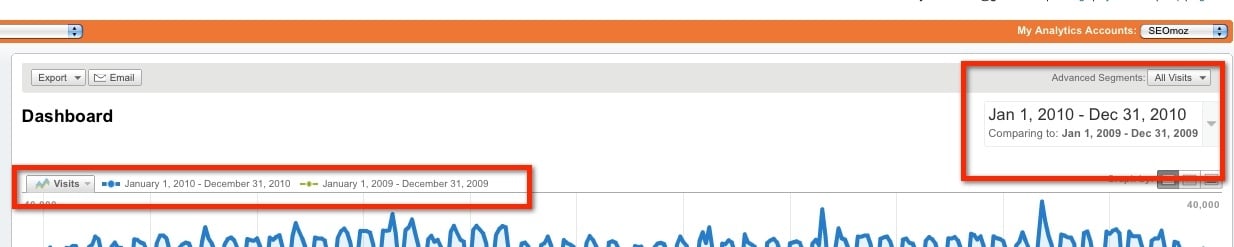
For those of you wondering the easiest way to get YOY data, if you are in GA, note the below screenshot. You can set the "Compare to" dates to be 2010 and 2009, and don't forget you can change the data represented from visits to whatever you are interested in looking at.
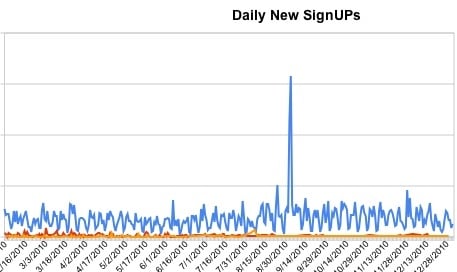
If you switched analytic packages in the past two years, you might need to pull the data into excel from your two sources and create graphs there. Here is an example of what our Operations team tracks in excel. We will definitely be using this data in the coming year for a lot of sign up YOY comparisons:
When it comes to pulling YOY stats, it might take some time to get it formatted in a useful manner. Trust me though, it's worth the few hours you take playing in reports and excel.
So what should you be looking at?
1. General health review
This is YOY analysis at it's most basic--have any of your site stats absolutely plummeted? As you collect data over the year you may see slight dips, and they not be red flags at the time, but in your YOY analysis you can now see that you are averaging a 15% higher bounce rate across your site that the year before. Three words folks: bad news bears.
This is what I mean by a general health review. You have internal goals for your site's performance, and YOY analysis lets you quickly identify any of the metrics that failed to meet your expectations. Specific metrics to keep an eye on are things like; analytic vitals (time on site, bounce rates, etc.) visitor engagement metrics (visitor recency, visitor frequency, etc.), and traffic drivers (branded term performance, your head term traffic, keyword queries that are historically conversion winners, etc.).
Other performance metrics to keep front-of-mind are things like value per visit (VPV), and cost per visit (CPV). While it's great that this year you made twice as much more money as the year before, you should also know if you are paying 1/3 more to acquire those successes. What if you could tweak something on performance and get that spend back down while maintaining increased performance? Then you are 133% above last year. These caveats in ROI calculations can make a big difference as you expand channels, and grow programs.
2. Dive deep into significant fluctuations
YOY data analysis is a great tool for gauging momentum gained or momentum lost on your site this past year. Do you see seasonal trends that show up year over year, and are they holding true? For some industries this may not be the case, but for quite a few industries you will see peaks and valleys around similar times of year. Pay special attention to the peaks. Believe it or not the valleys are easier to isolate out in smaller data segments, the real questions is did you see the seasonal jumps you usually see each year? If not, you may have an issue brewing. This is must easier to identify in YOY analysis.
See below picture for an example of how you can isolate out fluctuations and then easily research if they are accounted for.

** The yellow highlights were peaks and valleys in 2010 that matched the norm for 2009, but the two pink highlights weren't represented in 2009. Further research revealed they were due to us launching the web app and one of Rand's most popular posts of 2010. These are good things to know.
3. Use YOY data to measure the success of last year's company goals
I bet you all know if you hit your 2010 revenue goals, don't ya? How about traffic goals? What about your secondary metrics? Things like specific channel goals? Do you know if you are seeing that 10% jump in referral traffic you wanted to get by the end of the year? Do you know if you doubled the number of keywords driving traffic to your site like you wanted?
I blame the fact that we are all in the Inbox weeds at the beginning of the year, but I am also guilty of forgetting to circle back on last year's goals. Your YOY data is especially valuable when you want to quickly identify if you accomplished all you set out to do. Plus you can show all of these pretty comparison charts to your boss when you ask for that 2011 bump in pay.
4. Use YOY data to guide this year's company goals
We all know that accurate performance projection is an art form. In fact our VP of Marketing, Jamie Steven, is the in-house whiz on this, but I am realizing more and ore that good predictions involve a lot of data crunching. Last year's performance is one of those vital indicators not just on potential success, but on what times of year you may see drops you need to plan ahead for. Having YOY data to work from helps you be even more accurate in those predictions.
You can see below what parts of the year we see a drop in one of our key metrics--signups by month. You can imagine that our acquisition goals for next year (set on a week by week basis) will be adjusted accordingly during those times of year.
5. Find the Wild Card of Data Awesomeness
What the heck am I talking about? I'm talking about your low hanging fruit. When you do YOY research you often come across one or two metrics that literally have not seen much action or possibly seen recent minimal wins. With a little effort these guys can be quick wins for the company. If you can isolate out one or two of these and then build marketing campaigns around them, you can see big successes early in the year. It's a great way to start the year, don't you think?
A great examples would be to isolate out the long tail keyword wins (those words that ended up converting for you, or ones that now drive significant traffic) of the year before last, and take the ones of this past year, and see if you can combine them for a new category of long tail queries to go after. These would be less competitive to acquire traffic from, and you've already proven they will return.
It would be worth it to see what title tag queries got traction in 2009, and start building content around the topic. People are looking for it, and it could be a quick 2011 content win for us.
So there you have it. These are just some of the ways you can take your YOY stats and milk them for data goodies. I know the beginning of the year we are all looking forward, but before you do, I urge everyone to take a little time and look backwards.
So cheers to a new year of data collection friends...may this year be full of beautiful charts, insightful finds, and the resulting ROI successes.


Comments
Please keep your comments TAGFEE by following the community etiquette
Comments are closed. Got a burning question? Head to our Q&A section to start a new conversation.