
T
Illustrated Guide To Web Experiments
The author's views are entirely their own (excluding the unlikely event of hypnosis) and may not always reflect the views of Moz.
Web experimentation is a great tool to increase engagement and conversion rates. The primary strength of experiments is the possibility to isolate variables, and thus examine causality between different metrics such as tagline and conversion rate.
Much of the literature on experimental design has its roots in statistics and can be quite intimidating. To make it more accessible, I introduce the illustrated guide to web experiments (with some help from my brother, Andreas Høgenhaven, who kindly made the illustrations).
Before getting started on the experiment, you need to get the basics right: Test metrics that align with your long term business goals. Test big changes, not small. And remember that the test winner is not the optimal performance, but only the best performing variation we have tested. It doesn’t mean that you have found the all time optimal performing variation. You can (almost) always do better in another test.
A/B or MVT
One of the first things to consider is the experimental design. An A/B test design is usually preferred when one or two factors are tested, while a multivariate test (MVT) design is used when two or more independent factors are tested. However, it is worth noting that 2+ factors can be tested with A/B/n tests or with sequential A/B tests. The downside of using A/B test for several factors is that it does not capture interaction effects.
.png)
MVT Face-off: Full Factorial vs Fractional Factorial
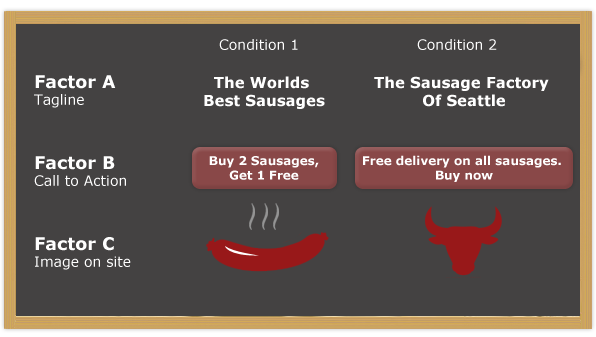
So you want to go multivariate, huh? Wait a second. There are different kinds of multivariate tests. If you have ever visited Which MVT, you probably came across terms such as full factorial, fractional factorial, and modified taguchi. Before getting into these wicked words, let's get our multivariate test down to earth with an example. In this example we have 3 different factors, and each factor has two conditions.
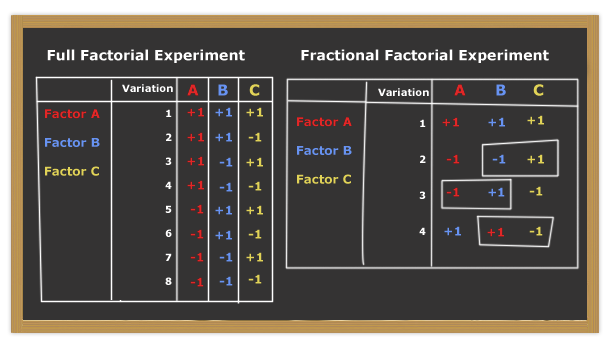
In this case there are 3 factors each with 2 combinations, giving a total of 23 = 8 groups. In the full factorial design, all possible combinations are tested. This means 8 variations are created, and users are split between these. In the following table, +1 Indicates condition on while -1 indicates condition 2.
This design is not too bad when we have 3 factors with 2 conditions in each. But if we want to test 4 factors each comprising 4 conditions, we will have 44 = 256 groups. Or if we want to test 10 different factors with 2 conditions in each, we will end up with 210 = 1,024 groups. This will require a lot of subjects to detect any significant effect of the factors. This is not a problem if you are Google or Twitter, but it is if you are selling sausages in the wider Seattle area (You can calculate the test duration time with Google's Calculator and VisualWebsiteOptimizers Calculator. These calculators are, however, based on very imprecise data because the change in conversion rate is unknown. That is kinda the point of the test).
Enter fractional factorial design. The fractional factorial design was popularized by Genichi Taguchi and is sometimes called the Taguchi design. In a fractional factorial design, only a fraction of the total number of combinations are included in the experiment. Hence the name. Instead of testing all possible combinations, the fractional factorial design only tests enough combination to calculate the conversion rate of all possible combinations.
In this example, it is sufficient to run 4 different combinations, and use the interaction between included factors to calculate combination of factors not included in the experiment. The 4 groups included are ABC; A + (BC); B + (CA); C + (BA).
Instead of testing Factor A 3 times, it is only tested once while holding B and C constant. Similarly, Factor B is tested once while holding A and C constant, and Factor C tested once while holding A and B constant. I'll not deep too deeply into the statistics here, as the experimental software does the math for us anyway.
The fractional factorial test assumes that the factors are independent of one another. If there are interactions between factors (e.g. image and headline), it'd affect the validity of the test. One caveat of the fractional factorial design is that one factor (e.g. A) might be confounded with two-factor interactions (e.g. BC). This means that there is a risk that we end up not knowing if the variance is caused by A or by the interaction BC. Thus, if you have enough time and visitors, full factorial design is often preferable to fractional factorial design.
Testing The Test Environment With The A/A Test
Most inbound marketers are quite familiar with A/B tests. But what is less known is the A/A test. The A/A test is useful as a test of the experimental environment, and is worth running before starting A/B or MVT tests. The A/A test shows if the users are split correctly, and if there are any potential misleading biases in the test environment.
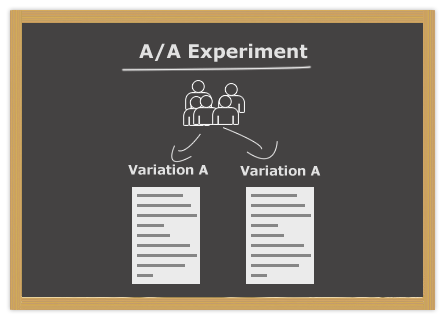
In the A/A design, users are split up like they are in an A/B or MVT test, but all groups see the same variation. We want the test results to be non-significant, and thus see no difference between the groups. If the test is significant something is wrong with the test environment, and subsequent tests are likely to be flawed. But as discussed below, an A/A test is likely to be significant sometimes, due to random error / noise.
The A/A test is also a good way to show co-workers, bosses, and clients how data fluctuate, and that they should not get too excited when seeing an increase in conversion rate with 80% confidence. Especially in the early phases of experiments.
Statistical Significance
In the ideal experiment, all variables are held constant except the independent variable (the thing we want to investigate, e.g. tagline, call to action, and images). But in the real world, many variables are not constant. For example, when conducting an A/B test, the users are split between two groups. As people are different, the two groups will never comprise similar individuals. This is not a problem as long as the other variables are randomized. It does, however, inflict noise in the data. This is why we use statistical tests.
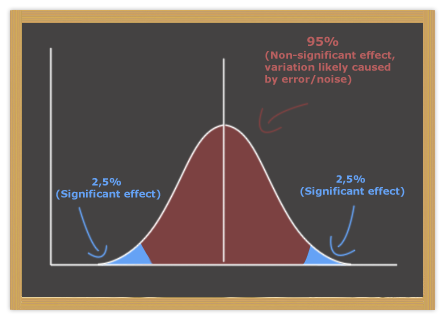
We conclude that a result is statistically significant when there is only low probability that the difference between groups is caused by random error. In other words, the purpose of statistical tests is to examine the likelihood that the two samples of scores were drawn from populations with the same mean, meaning there is no "true" difference between the groups, and all variation is caused by noise.
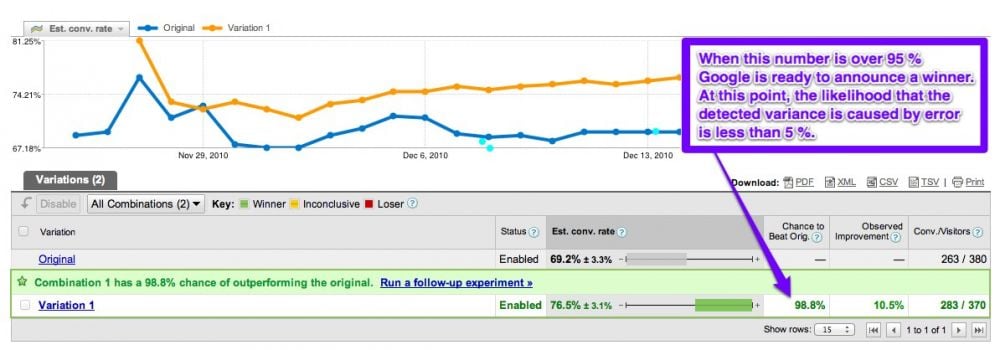
In most experiments and experimental software, 95% confidence is used as the threshold of significance, although this number is somewhat arbitrary. If the difference between two group means is significant at 98% probability, we accept it as significant even though there is a 2% probability that the difference is caused by chance. Thus, statistical tests show us how confident we can be that difference in result are not caused by chance / random error. In Google Website Optimizer, this probability is called chance to beat original.
Pro Tip: Ramp Up Traffic To Experimental Conditions Gradually
One last tip I really like is ramping up the percentage of traffic sent to experimental condition(s) slowly. If you start out sending 50% of the visitors to the control condition, and 50% to the experimental condition, you might have a problem if something in the experimental condition is broken. A better approach is to start sending only 5% of the users to the experimental condition(s). If everything is fine, go to 10%, then 25% and finally 50%. This will help you discover critical errors before too many users do it.
Ps. If you want to know more / share your knowledge on experiments and CRO tools, you might want to have a look at this CRO Tools Facebook Group.


Comments
Please keep your comments TAGFEE by following the community etiquette
Comments are closed. Got a burning question? Head to our Q&A section to start a new conversation.