
Is Your Linkbuilding Working? How to Easily Check Using Webmaster Tools and a Pivot Chart
The author's views are entirely their own (excluding the unlikely event of hypnosis) and may not always reflect the views of Moz.
Is all that time spent doing linkbuilding helping you acquire links faster than you would acquire them without linkbuilding? This guide will help you determine if the rate with which your site is acquiring links is any different than the rate your site acquires links naturally.
Pulling the Data
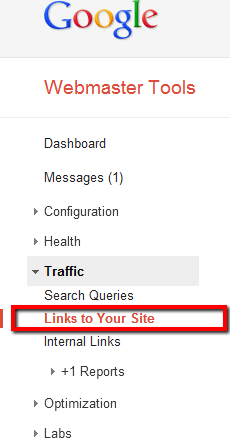
To start this process you will need to have already verified your site in webmaster tools. Once verified, navigate to the Traffic>>Links To Your Site section of webmaster tools.
From here you will see three sections: who links the most, your most linked content, and how your data is linked. Click "More>>" under the who links the most section.
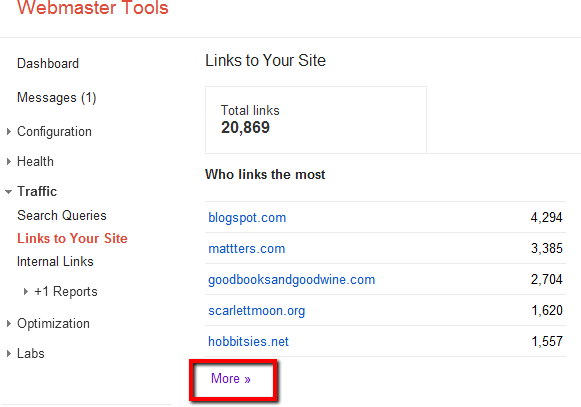
Once you have clicked for more, you should see a list of domains that are linking to you, the number of links, and the number of linked pages. What you will also now see is the ability to download the latest links.

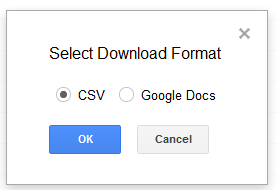
While I love Google docs, for this example I recommend downloading a CSV and using Excel.
Using the Data to Identify if You are Picking up Links Any Faster than Before You Started Linkbuilding
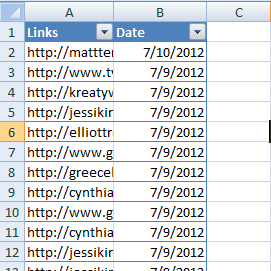
You should now have a CSV file open in excel with two columns, one with the linking domain and the other with the date the link was acquired (or spotted by Google). The first thing I recommend is formatting the data as a table.
What you are going to do now is split up the list of links into pieces based on the date you or your SEO company started doing linkbuilding. If you stared linkbuilding six months ago, select the last six months of links and cut and paste them in a new column.
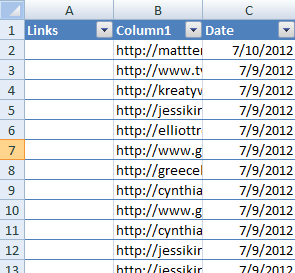
This New Column will be the links after you started linkbuilding (or hired someone to do linkbuilding) The next step is to create another new column that has a date range equal to your date range for your "linkbuilding" column. We can call this column "Just before Linkbuilding". In this column you will cut and past the links from the original "links" making sure that you do not get out of position vertically within the list.
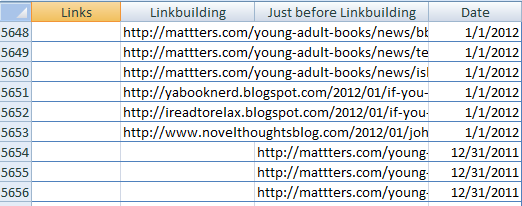
You now have three columns of links all in alignment with their corresponding dates. It's time to turn this data into a Pivot Chart.
Creating a Pivot Chart
With you data all setup you can now insert a pivot chart.


You should now see a blank pivot table and chart. In the lower right corner of the screen you will see an area that has four sections ( Report Filter, Column Labels, Row Labels, Values) Drag the items from the Pivot table Field list into each of these boxes as you see here.
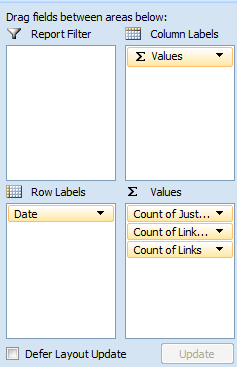
As you do this you will notice your pivot table and chart come to life. The next step is to group the dates by month to make the pivot chart a bit easier to read. To do this, within your pivot table, right click on any date and select group.

Now Select Years and Months and hit Ok.
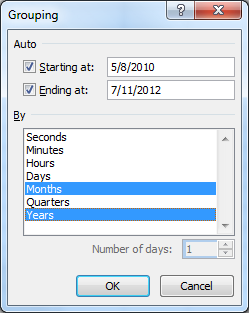
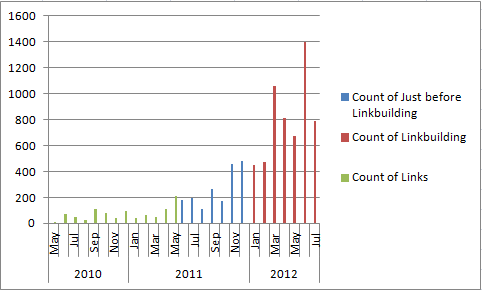
You should now have a nice easy to read chart with your links broken into three sections and organized by year and month. Mine looks like this:
The next step is to add trendlines to each of the three sections (data series), to really identify any changes in link acquisition rate. I find the easiest way to do this is to right click on one of the columns in the chart and select "add trendline".

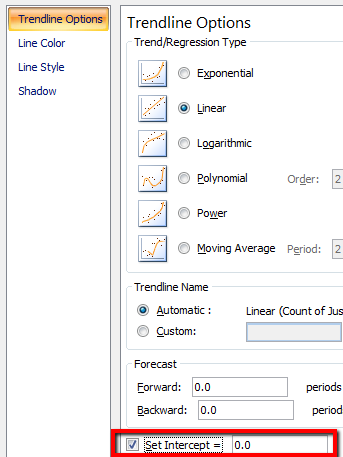
You will be presented with a set of trendline options. There are two options I suggest changing, the first option is I suggest selecting set Intercept, this will result in all of your trendlines intercepting the x axis at 0, the second recommendation is setting the trendline color to match the series you are creating this trendline for, it just makes it easier to look at.

The Results
You now have a chart that clearly shows the liner trend with which your site is acquiring links broken down into segments based on your time linkbuilding (or hiring someone to do linkbuilding), just before linkbuilding, and historically before that. If you don't see a change in slope between the trendline for before linkbuilding and during it, something is probably not working with your linkbuilding campaign.
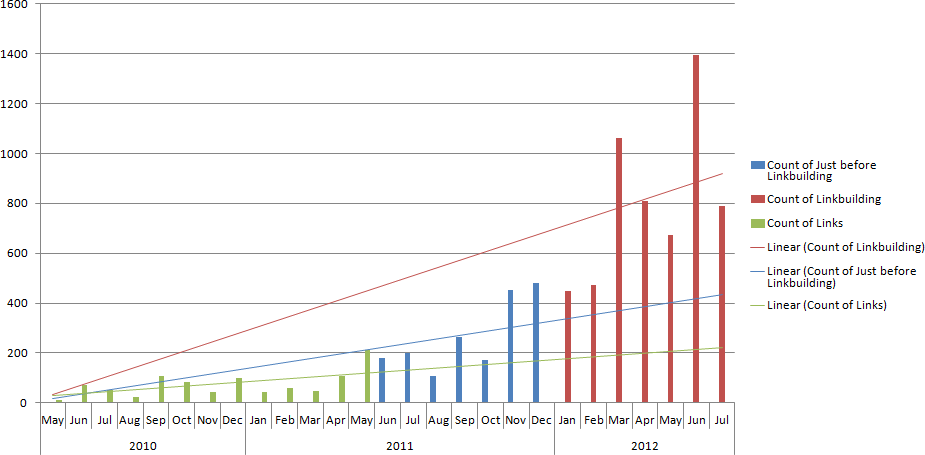
Note: for greater accuracy, you would NOT set intercept to zero and you would compare the slopes of the lines, but for a quick view and more organized graph, this gets the job done.


Comments
Please keep your comments TAGFEE by following the community etiquette
Comments are closed. Got a burning question? Head to our Q&A section to start a new conversation.