Statistics 101: Averages
This YouMoz entry was submitted by one of our community members. The author’s views are entirely their own (excluding an unlikely case of hypnosis) and may not reflect the views of Moz.
This is my first attempt at a YOUmoz post. I decided that given my background it would be a good idea to write about something I know – statistics. We are all familiar in the SEO world with statistics. We use averages, trends and split test results to make recommendations, justify ourselves to clients, and generally impress everyone. However, it is sometimes difficult to take a step back.
For example, you may remember from statistics classes long ago that there is more than one type of average. So, what you’ve been reporting to clients and HiPPOS is an average – probably the mean. But have you considered the others? They can each have their part to play in a successful SEO strategy.
Given that this most basic and stable part of SEO has its own nuances that we often forget, I thought it was high time someone came along and wrote a series of posts, breaking things down into chunks and giving examples of how each measure can be used in SEO:
Part 1 – Averages. The most common statistical technique that can still reveal some surprising details.
Part 2 – Deviations. Standard and otherwise. Perhaps including some discussion on analysing multivariate testing and using homo- and heteroschedastic distributions to predict trends.
Part 3 – Skewness. How symmetrical a distribution is.
Part 4 (possibly, if you want it) – Kurtosis and confidence intervals. How far away from a Gaussian or normal distribution is my data? What does it mean to have a confidence interval of 95%?
The Mean
Taking the average, or mean, of a data set is probably the most used statistical technique in the world. It is the simplest, most powerful way to report on the data we SEOs see in front of us every day, right?
Well, maybe. The mean is certainly useful, but it is not the whole story. I’m sure you can all think of cases where the mean would not be a useful way to measure things, but we still use it because our clients and HiPPOS are easily confused, bless their cottons, and need something they can understand. But can we make use of other forms of the average in our daily work?
The Mode
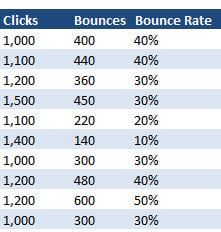
Imagine you are the SEO for an fictitious tourist attraction. Here are a selection of ten daily bounce rates for an important paid search keyword:

As you can work out easily, the mean for this data set is 32%. What does this tell you? Not too much, really. However, take a look at the most commonly occurring bounce rate, 40%. This is the mode or modal class, and it may be possible to find some interesting, and actionable, points using the mode.
For example, you may have noticed that two of the modal values occur next to each other, and that the next occurrence of this value was followed by the day with the highest bounce rate of the sample. This could set you wondering.
Investigating, you might found that although the mean bounce rate for the last 12 months was 31% (it could happen) the modal value was 40%, and this value occurred every Monday and Tuesday. Being a disciple of Occam’s Razor, you ask “so what?” for the first time. Well, you knew that the company ranked well for this keyword, so you checked the data and saw the same pattern – this is a probably trend not a quirk. So what? Since you ranked well for this keyword you decided to pause your paid efforts for it on Mondays and Tuesdays. This lowered bounce rates by 5% on average and brought paid conversion rates up by 3%. So what? So you got a happy HiPPO, and a bigger bonus. Nice one!
The Median
In most cases the median, simply the value separating the top half from the bottom half of the data, should be around the same as the mean. This is because unless something changes, you start pushing CRO for example, you would expect your population to behave randomly. However, if a graph is skewed this will not be the case.
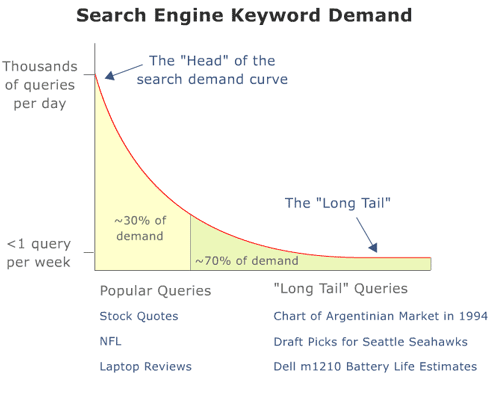
We all know a good example of a skewed graph – the famous long tail. Here, the tail is to the right of the bulge, so the median will be to the left of the mean. The median is therefore a quick and dirty way to tell whether a data set is skewed.

As we can see from this example, the median becomes a more useful average to use when there are a number of outlying data points – something that will be dealt with under kurtosis.
So What?
As you can see from this post, although the mean is an extremely useful tool, it is very useful to consider other measures at some point. Each has its own place, and each can offer a certain level of detail. It is only by considering each technique in its appropriate place that we can really address the question “So what?” in SEO. However, we cannot use averages of any kind in isolation, which is where deviations come in. But you'll have to wait a week for that.


Comments
Please keep your comments TAGFEE by following the community etiquette
Comments are closed. Got a burning question? Head to our Q&A section to start a new conversation.