The Holy Grail of Long Tail Information Finally Trackable
This is a feature I've been asking for in analytics packages for the last 2 years:

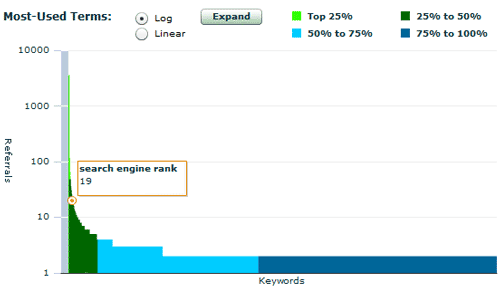
This report lets a search marketer actually visualize the healthiness and distribution of their site's keyword-based search traffic. In the example above, I'm showing the report for SEOmoz (which contains data from the past 40-50 days). As you slide your mouse along the graph, you can see that the top 25% of our referrals are made up of searches that have sent ~50+ referrals each, while the bottom 25% (actually, much more) is made up of searches that have sent only a single visitor. Not only does this illustrate the power and importance of the long tail, it helps make the case for a lot of marketing departments strapped for data ammunition.
We've recently had several large web properties as clients, and as anyone with a sizable site knows, the volume is all in the tail. Using long tail charts, we can now do things like:
- Explain why content development as a whole is much more important/valuable than singular rankings to confused executives
- Watch the healthiness of our head vs. tail efforts - if the tail starts losing out, indexing problems are often to blame, and if the head suffers, we may be losing link juice, have architectural problems or even be experiencing a penalty (or, more often, the result of an unfavorable algo shift).
- Determine where traffic might be rising or gaining on a macro level, even with very large sites. This is one of the biggest problems I find in large SEO campaigns - visualizing success is just hard to do, making it tough to know which efforts are working.
Here's a few more juicy screenshots:

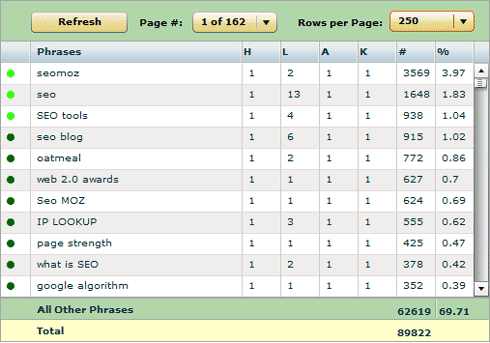
The chart feature is great, and it offers a lot of functionality. I especially like being able to segment the graph/chart by PPC vs. Organic, which is available (it just doesn't show in this screen cap).

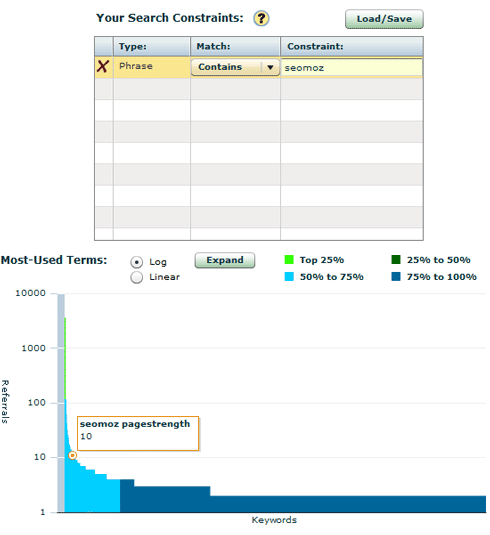
Here's where the functionality gets seriously advanced. By dragging keywords from the chart into the search constraints box, you can restrict the graph and chart to only those data points that match up. In this example, I've chosen to only see "branded" search traffic referrals - that is - those that contain the phrase "seomoz" in the query. I turns out, that's about 10% of our traffic (a little less) and yet the long tail is equally prevalent here, with 1-5 visit frequency taking up almost 50% of total branded search traffic. This is really, really useful stuff for advanced SEOs attempting to track success of individual keyword-based campaigns.

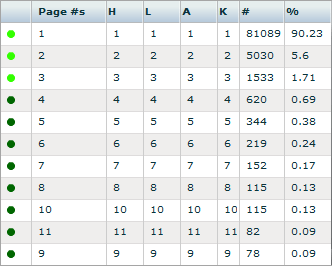
Enquisite is really smart about keeping keyword referral data from the engines, including which page sent the traffic. This means I can actually see how I'm doing search ranking wise with my traffic, and even narrow down to page-2-referrals-only to help find the low-hanging fruit if I so choose (pretty sweet, huh?). You can see that for SEOmoz over the past 40 days, 90.23% of our traffic comes from page 1, and a very small percentage from anything else (although it's pretty funny that page 10 sends more traffic than page 9).
All in all, this tool is a real "next-generation" leap in terms of what search marketers can measure through web analytics, and we're very proud to have been able to partner with Enquisite to design the tools and metrics. Right now, this beta version of Enquisite is only available to SEOmoz's PRO members, but after the beta, it will be opened up to everyone. Right now, if you're a PRO member, access to Enquisite's Analytics is available at the top of your PRO Tools Dashboard.
For any non-PRO members interested in checking out the service, you can either wait until the beta is finished, or get in touch directly with Richard Zwicky or Emily Spence from Enquisite (who'll both be sure to stop by this post and check out comments).
p.s. The Enquisite tool is currently just geared towards search engine referral tracking, so I'd still recommend keeping a standard analytics provider like Indextools (which we use) or Gatineau/GA for the rest of your web analytics data.
The author's views are entirely their own (excluding the unlikely event of hypnosis) and may not always reflect the views of Moz.


Comments
Please keep your comments TAGFEE by following the community etiquette
Comments are closed. Got a burning question? Head to our Q&A section to start a new conversation.