
Tips For Understanding Data: Regression Analysis
Note: This post does not have a great deal of SEO advice per se. But I will give some insight into some of the technical details of how we come up with PageStrength scores and give a sneak preview of a product we'll be launching soon.
Update: The tool mentioned below is probably more the work of the rest of the dev staff: Jeff, Mel, Mike, and Timmy. They put in a lot of long hours while I was doing stuff like this post.
Here at the mozPlex we've been hard at work on some new tools (see below for exclusive early preview screenshots!). One of the things we try to do is incorporate some of the great advice that's already out there. At the latest SMX Advanced I heard from SEOs and Search Engine reps alike that we should focus on data, and for goodness sake not just to check your rank! So we've been crunching some numbers... a lot of numbers. And all that data can start to get a little confusing. We've employed a few techniques, including regression analysis, to help us make sense of our data. I actually whipped up an online regression tool to help out.
The particular issue we're trying to understand is illustrated in the image below:
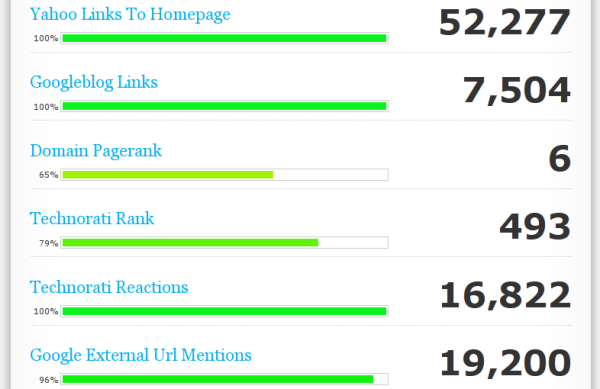
You can see that we're pulling some great data together from some very authoritative sources. However, if you notice the numbers along the right-hand side, you can see that there's a lot of different scales, and if you know anything about any of these metrics you know that the difference between 5 url mentions and 50 is quite a lot different than the difference between 20,005 and 20,050.
Suppose we're trying to understand the importance of the number of domain mentions as reported by Google. Likely, more domain mentions across the web means your domain has a greater ranking strength and influence. But how can we make that more precise? Is 100 mentions good? Is jumping from 1000 to 1100 a big jump? What should be 10% and what should be 90%? If you're a savvy SEO (and I actually know a few around here and abroad) you can come up with some examples:
I've hidden the sites I got these from to protect the innocent ;) But you can get the idea: get some real-world examples for whom you've got some idea of how they should be labeled. Here we've said, all else being equal, 866,000 or more domain mentions is about as strong as can be. We've also given some idea of where the rest of the scores lie. The bigger question is where should we fit new data that we haven't seen before? That's where the regression analysis comes in.
The idea is to come up with some equation, a model, that matches the pattern we observe -- in this case, what you might intuitively believe as a smart SEO. You can check out what my tool will suggest for this data.
You'll notice that, in addition to the specific model I recommend, I also include a couple of graphs. If you've done this before, you know how important it can be to get a feel for what your data looks like and how your fitted model compares. I also include a graph of the "residuals," which are the errors in the model's estimates. For instance, if you ask for 80% at 247,000 domain mentions, and the model predicts 75.55, the residual is 4.45. It's often valuable to think about the square of the residual for statistical reasons (that's the "residual sq" column in the table). The square of the residual also helps to emphasize larger errors.
Intro stuff done, let's get advanced! For this particular data you'll notice (go ahead and open that "suggest" link above in a new tab), that our observations are capped at 100. This is an artifact of the 100 point scale, and poses some mathematical difficulties for simple modeling techniques. You'll also notice that the suggested model does quite poorly in the middle range. So here are a couple of tips:
If you have a truncated scale, like our 100 point scale here, it's valuable to let your model predict outside the range and truncate its estimates later. To do this you can, for example, drop the extra truncated observations from your data (1,890,000 -> 100 and 1,280,000 -> 100). Just delete those rows from the text box and click that "fit model" button and you'll get better results.
Also, the algorithm I'm using tries to match all the data points as if they are all equally important. If you feel that some range of your data is more important, just add more observations in that range. For instance, we might want to come up with some more examples between 30% and 65%, since this range is not well fitted by our initial models, and most of our users will probably fall into this range. For example, we might add 26,900 -> 38% and 47,000 -> 50%. With these new observations the model will emphasize this range of the data.
You should also consider the other possible models, even if they are not "suggested." You might like the behavior of a power model over a logarithmic, for instance. Just click the links for the other models and see the graph of the model and its residuals.
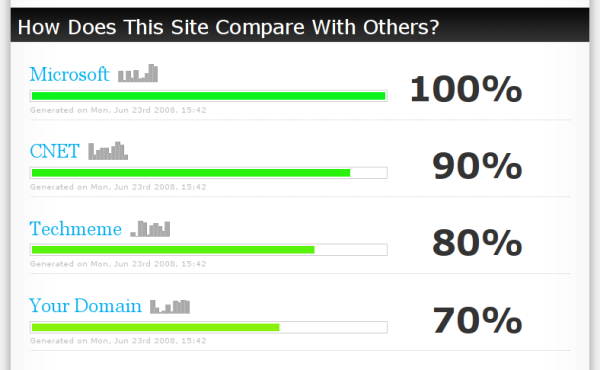
We're using these techniques in-house to score our users' pages, domains, and blogs (check out the screenshot below!), but you can use these techniques to better understand the behavior of data. The next time someone says, "What will happen if we double factor X?", you can turn to your body of experience and mathematical model and tell them, "In general, the importance of factor X falls off on a logarithmic scale. Let me show you graphically..."
Here's just one example of how we're going to use all these nifty models:
So keep your eyes peeled for evidence that college stats still matters!
Update: The tool mentioned below is probably more the work of the rest of the dev staff: Jeff, Mel, Mike, and Timmy. They put in a lot of long hours while I was doing stuff like this post.
Here at the mozPlex we've been hard at work on some new tools (see below for exclusive early preview screenshots!). One of the things we try to do is incorporate some of the great advice that's already out there. At the latest SMX Advanced I heard from SEOs and Search Engine reps alike that we should focus on data, and for goodness sake not just to check your rank! So we've been crunching some numbers... a lot of numbers. And all that data can start to get a little confusing. We've employed a few techniques, including regression analysis, to help us make sense of our data. I actually whipped up an online regression tool to help out.
The particular issue we're trying to understand is illustrated in the image below:
You can see that we're pulling some great data together from some very authoritative sources. However, if you notice the numbers along the right-hand side, you can see that there's a lot of different scales, and if you know anything about any of these metrics you know that the difference between 5 url mentions and 50 is quite a lot different than the difference between 20,005 and 20,050.
Suppose we're trying to understand the importance of the number of domain mentions as reported by Google. Likely, more domain mentions across the web means your domain has a greater ranking strength and influence. But how can we make that more precise? Is 100 mentions good? Is jumping from 1000 to 1100 a big jump? What should be 10% and what should be 90%? If you're a savvy SEO (and I actually know a few around here and abroad) you can come up with some examples:
| Domain Mentions | Value |
|---|---|
| 1890000 | 100 |
| 1280000 | 100 |
| 866000 | 100 |
| 659000 | 96 |
| 584000 | 94 |
| 247000 | 80 |
| 115000 | 65 |
| 32500 | 45 |
| 13400 | 30 |
| 11300 | 28 |
| 6590 | 15 |
| 218 | 5 |
| 4 | 1 |
The idea is to come up with some equation, a model, that matches the pattern we observe -- in this case, what you might intuitively believe as a smart SEO. You can check out what my tool will suggest for this data.
You'll notice that, in addition to the specific model I recommend, I also include a couple of graphs. If you've done this before, you know how important it can be to get a feel for what your data looks like and how your fitted model compares. I also include a graph of the "residuals," which are the errors in the model's estimates. For instance, if you ask for 80% at 247,000 domain mentions, and the model predicts 75.55, the residual is 4.45. It's often valuable to think about the square of the residual for statistical reasons (that's the "residual sq" column in the table). The square of the residual also helps to emphasize larger errors.
Intro stuff done, let's get advanced! For this particular data you'll notice (go ahead and open that "suggest" link above in a new tab), that our observations are capped at 100. This is an artifact of the 100 point scale, and poses some mathematical difficulties for simple modeling techniques. You'll also notice that the suggested model does quite poorly in the middle range. So here are a couple of tips:
If you have a truncated scale, like our 100 point scale here, it's valuable to let your model predict outside the range and truncate its estimates later. To do this you can, for example, drop the extra truncated observations from your data (1,890,000 -> 100 and 1,280,000 -> 100). Just delete those rows from the text box and click that "fit model" button and you'll get better results.
Also, the algorithm I'm using tries to match all the data points as if they are all equally important. If you feel that some range of your data is more important, just add more observations in that range. For instance, we might want to come up with some more examples between 30% and 65%, since this range is not well fitted by our initial models, and most of our users will probably fall into this range. For example, we might add 26,900 -> 38% and 47,000 -> 50%. With these new observations the model will emphasize this range of the data.
You should also consider the other possible models, even if they are not "suggested." You might like the behavior of a power model over a logarithmic, for instance. Just click the links for the other models and see the graph of the model and its residuals.
We're using these techniques in-house to score our users' pages, domains, and blogs (check out the screenshot below!), but you can use these techniques to better understand the behavior of data. The next time someone says, "What will happen if we double factor X?", you can turn to your body of experience and mathematical model and tell them, "In general, the importance of factor X falls off on a logarithmic scale. Let me show you graphically..."
Here's just one example of how we're going to use all these nifty models:
So keep your eyes peeled for evidence that college stats still matters!


Comments
Please keep your comments TAGFEE by following the community etiquette
Comments are closed. Got a burning question? Head to our Q&A section to start a new conversation.