

Visualizing Duplicate Web Pages
We've just changed the way we detect duplicate or near-duplicate web pages in our custom crawler to better serve you. Our previous code produced good results, but it could fall apart on large crawls (ones larger than about 85,000 pages), and takes an excessively long time (sometimes on the order of weeks) to finish.
Now that the change is live, you’ll see some great improvements and a few changes:
- Results will come in faster (up to an hour faster on small crawls and literally days faster on larger crawls)
- More accurate duplicate removal, resulting in fewer duplicates in your crawl results
This post provides a look into the motivations behind our decision to change the way our custom crawl detects duplicate and near-duplicate web pages at a high level. Enjoy!
Improving our page similarity measurement
The heuristic we currently use to measure the similarity between two pages is called fingerprints. Fingerprints relies on turning each page into a vector of 128 64-bit integers in such a way that duplicate or near-duplicate pages result in an identical, or nearly identical, vector. The difference between a pair of pages is proportional to the number of corresponding entries in the two vectors which are not the same.
The faster heuristic we are working on implementing is called a similarity hash, or simhash for short. A simhash is a single, 64-bit, unsigned integer, again calculated in such a way that duplicate or near-duplicate pages result in simhash values which are identical, or nearly so. The difference between pages is proportional to the number of bits that differ in the two numbers.
The problem: avoid false duplicates
The problem is that these two measures are very different: one is a vector of 128 values, while the other is a single value. Because of this difference, the measurements may vary in how they see page difference. With the possibility of a single crawl containing over a million pages, that's an awful lot of numbers we need to compare to determine the best possible threshold value for the new heuristic.
Specifically, we need to set the heuristic threshold to detect as many duplicates and near-duplicates as possible, while minimizing the number of false duplicates. It is more important to absolutely minimize the number of page pairs which aren’t duplicates, so we’re not removing a page as a duplicate unless it actually *is* a duplicate. This means we need to be able to detect pages where:
- The two pages are not actually duplicates or near-duplicates,
- The current fingerprints heuristic correctly views them as different, but
- The simhash heuristic incorrectly views them as similar.
We’re being incredibly careful about this to avoid the most negative customer experience we anticipate: having a behind-the-scenes change of our duplicate detection heuristic causing a sudden rash of incorrect "duplicate page" errors to appear for no apparent good reason.
The solution: visualizing the data
Our need to make a decision where many numeric quantities are involved is a classic case where data visualization can be of help. Our SEOmoz data scientist, Matt Peters, suggested that the best way to normalize these two very different measures of page content was to focus on how they measured difference between existing pages. Taking that to heart, I decided on the following approach:
- Sample about 10 million pairs of pages from about 25 crawls selected at random.
- For each pair of pages sampled, plot their difference as measured by the legacy fingerprints heuristic on the horizontal axis (0 to 128), and their difference as measured by simhash on the vertical axis (0 to 64).
The plot resulting from this approach looks like this:
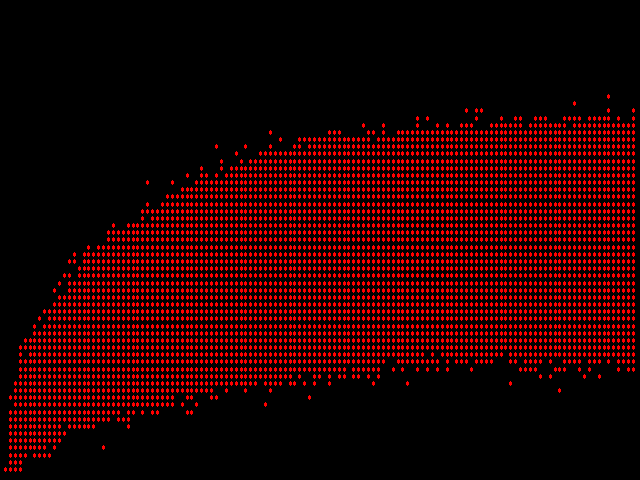
Immediately, a problem is obvious: there's no measure of central tendency (or lack thereof) in this image. If more than one page pair has the same difference as measured by both legacy fingerprints and simhash, the plotting software will simply place a second red dot precisely atop the first one. And so on for the third, fourth, hundredth, and possibly thousandth identical data point.
One way to address this problem is to color the dots differently depending on how many page pairs they represent. So what happens if we select the color using a light wavelength that corresponds to the number of times we draw a point on the same spot? This tactic gives us a plot with red (a long wavelength) indicating the most data points, down through orange, yellow, green, blue, and violet (really, magenta on this scale) representing only one or two values:
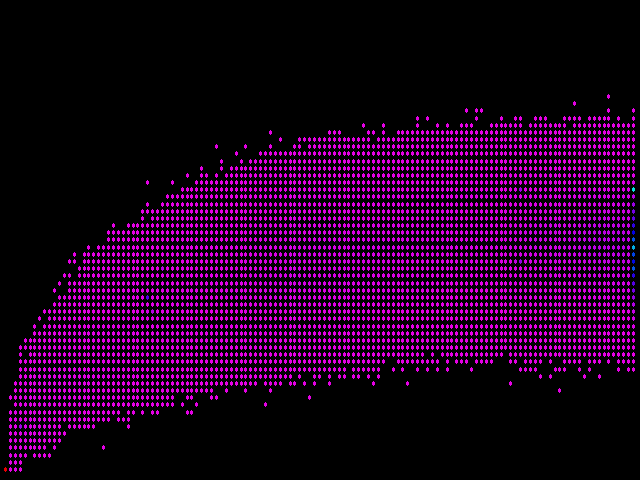
How disappointing! That's almost no change at all. However, if you look carefully, you can see a few blue dots in that sea of magenta, and most important of all, the lower-leftmost dot is red, representing the highest number of instances of all. What's happening here is that red dot represents a count so much higher than all the other counts that most of the other colors between it and the ones representing the lowest numbers end up unused.
The solution is to assign colors in such a way that most of the colors end up being used for coding the lower counts, and to assign progressively fewer colors as counts increase. Or, in mathematical terms, to assign colors based on a logarithmic scale rather than a linear one. If we do that, we end up with the following:
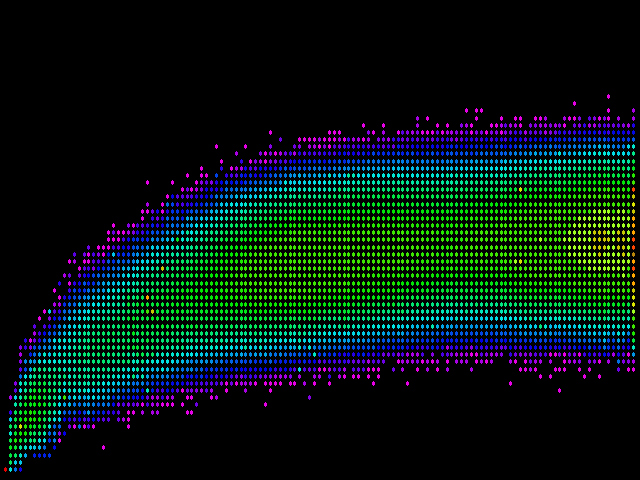
Now we're getting somewhere! As expected, there is a central tendency in the data, even though it's pretty broad. One thing that's immediately evident is that, although in theory, the difference measured by simhash can go to a maximum of 64, in practice, it rarely gets much higher than 46 (three-fourths of the maximum). In contrast, using the fingerprints difference, many pages reach the maximum possible difference of 128 (witness all the red and orange dots along the right side of the graphic). Keep in mind that those red and orange dots represent really big counts, because the color scale is logarithmic.
Where we have to be most careful is on the bottom edge of things. That represents simhash values which indicate pairs of pages that are quite similar. If two pages are not, in fact, similar, yet simhash measures them similar where fingerprints saw a significant difference, this is precisely the sort of negative customer experience we are trying to avoid. One potential trouble spot is circled below:

The circled dot represents a pair of pages which are actually quite different, yet which simhash thinks are quite similar. (The dot to the left and even further below turns out to not be a problem: it represents a pair of nearly duplicate pages that the old heuristic missed!)
The vertical position of the troublesome dot represents a simhash difference of 6 (6 corresponding bits in the two 64-bit simhash values differ). It's not the only case, either: occasionally, such pairs of pages come up from time to time. It happens in 1% or less of the crawls, but it does happen. If we choose a simhash difference threshold of 6 (matching the threshold we currently have defined for the legacy fingerprints), there will be false positives.
Picking a threshold
Thankfully, 6 seems to be a border case. Above 6 bits of difference, the chance of a false positive increases. Below 6, I was unable to find any such pathological cases, and I examined thousands of crawls trying to find one. So I chose a difference threshold of 5 for simhash-based duplicate detection. That results in a situation represented by the final graphic:
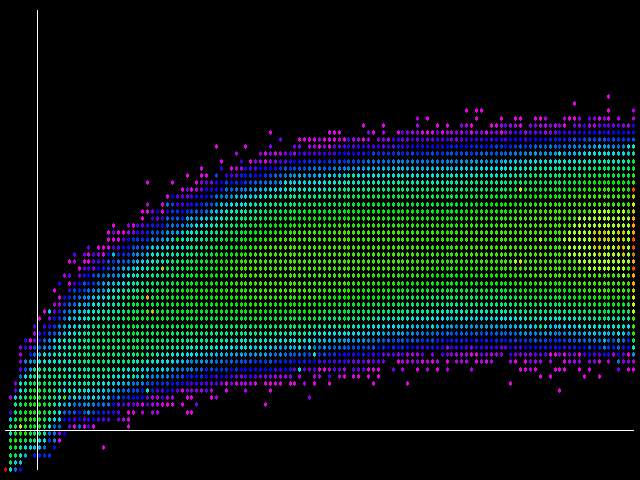
Here we have lines drawn to represent the two difference thresholds. Everything to the left of the vertical line represents what the current code would report as duplicate. Everything below the horizontal line represents what the simhash code will report. Keeping in mind the logarithmic color scale and the red dot in the lower-left corner, we see that the number of page pairs where the two heuristics agree about similarity outweighs the number of page pairs where they disagree.
Note that there are still things in the "false positive" (lower right) quadrant. It turns out that those pairs tend not to differ much from the pairs where the two measures agree, or, for that matter, from the false negative pairs in the upper left quadrant. In other words, with the chosen thresholds, both simhash and the legacy fingerprints miss seeing some true near-duplicates.
The visible results
With this threshold decision, the number of false negatives outnumbers the number of false positives. This meets our goal of minimizing the number of false positives, even at the cost of incurring false negatives. Note that the "false positives" in the lower-right quadrant are actually quite similar to each other, and therefore would more accurately be described as the false negatives of the legacy fingerprints heuristic, rather than the false positives of the fingerprints heuristic.
The most visible aspects of the change to customers are two-fold:
1. Fewer duplicate page errors: a general decrease in the number of reported duplicate page errors. However, it bears pointing out that:
- We may still miss some near-duplicates. Like the current heuristic, only a subset of the near-duplicate pages is reported.
- Completely identical pages will still be reported. Two pages that are completely identical will have the same simhash value, and thus a difference of zero as measured by the simhash heuristic. So, all completely identical pages will still be reported.
2. Speed, speed, speed: The simhash heuristic detects duplicates and near-duplicates approximately 30 times faster than the legacy fingerprints code. This means that soon, no crawl will spend more than a day working its way through post-crawl processing, which will facilitate significantly faster delivery of results for large crawls.
I hope this post provides some meaningful insight into our upcoming changes. I look forward to hearing your thoughts in the comments below.


Comments
Please keep your comments TAGFEE by following the community etiquette
Comments are closed. Got a burning question? Head to our Q&A section to start a new conversation.