

Weed Out Your Lowest Performing Pages [Panda Strategies]
This morning I set myself a challenge. Using some inspiration from recent excellent ideas, strategies and articles about the Panda update, I decided to see if I could cobble together a quick strategy to weed out pages that might be deemed as “low quality” in the eyes of Google's most recent major algorithm update.
I gave myself two hours to get the data and to put this post together, with the intention that you'll be able to download the template and pick up your analysis from where I left off.
It’s all about poor performance
This methodology should help you identify poorly performing pages that have few, if any links and a high average bounce rate across a wide spectrum of keywords. This might help you identify any page candidates that need a rethink.
Step 1 – Head to Google Analytics
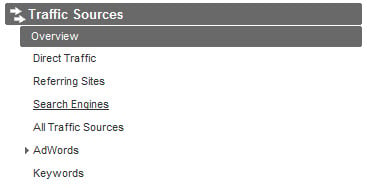
Head over to analytics and navigate to Traffic Sources > Search Engines:
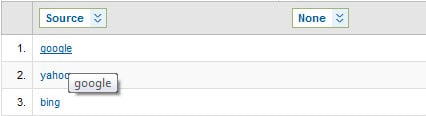
Now, select “Google”
Step 2 – Get lots of raw data
![]() Make sure you can get your hands on plenty of data by inserting the &limit=50000 query into your report URL. This might come in handy later!
Make sure you can get your hands on plenty of data by inserting the &limit=50000 query into your report URL. This might come in handy later!
Step 3 – Sort by landing page
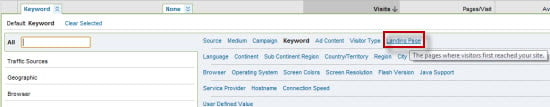
We’re interested in landing page performance, so in your left hand sort column, select “landing page”
Step 4 – Download the data as CSV and create an Excel Table
Ok so far so good – by now you should have a rich data set all tuckered up in Excel. To make your data into a table, highlight it and press CTRL-L on your keyboard.
Step 5 – Head to Open Site Explorer
Next, we’re going to export all the links data that Open Site Explorer can give us, and use VLOOKUP to add the number of links to each URL in our table. Whee!
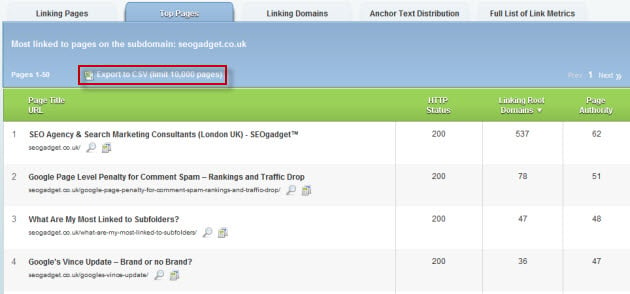
If you’re not familiar with VLOOKUP, check out Mike’s awesome guide to Excel for SEOs. Create an Open Site Explorer top pages report (My favourite report since, ever), download the data and throw it in an Excel tab called “Top Pages”.
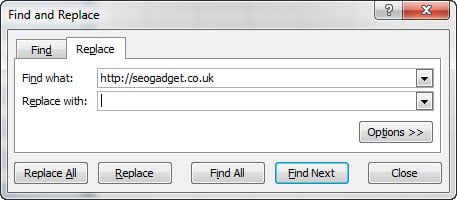
Tip: for the purpose of this blog post, you’ll need to remove the domain name from the Open Site Explorer data. Do a find and replace for your domain, replacing the domain URL with nothing, like this:
Step 6 – VLOOKUP time
Next, you’re going to need to combine the analytics data with the top pages data from OSE. Create a new column in your analytics data called “Links” and add your VLOOKUP, just like this:
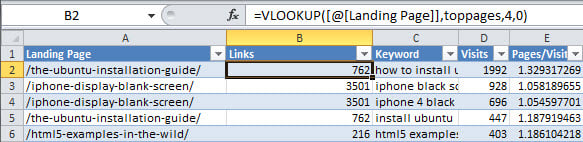
Pro tip: use IFERROR to weed out any nasty N/A errors, replacing them with a 0, like this:
=IFERROR(VLOOKUP([@[Landing Page]],toppages,6,0),0)
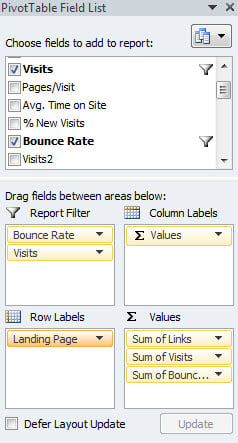
Step 7 – Create your pivot table
With a complete data set, you’re now able to create your pivot table. Insert a pivot table and setup your filters, labels and values like this:
Step 8 – Filter by bounce, visits and use conditional formatting
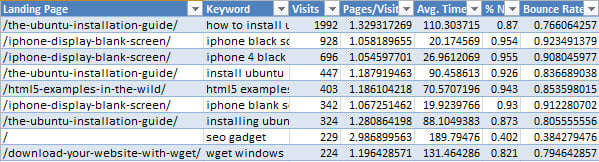
At the end of my data mashing, I came up with this table:
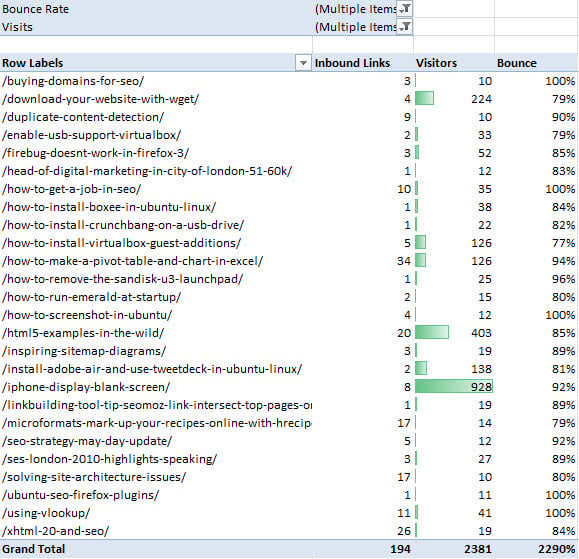
I can only imagine what this data might look like on an extremely content thin, "low value" site. Any page with a very high bounce rate, measurable level of traffic and low / no links might cause some concern and there are certainly a few pages in this list I’d like to take a closer look at.
If you'd like to take a closer look at your pages, you can download this Excel document here:
PRO Tip: Add your keyword data
I have a working theory that it’s good to have a complete picture of a landing page’s performance. In principle, you could build a more complete picture using keyword data. Think about it like this: if a page has a slightly below par bounce rate, with the keyword data intact you can investigate the problem a little further. Is there a specific keyword that’s causing a problem? How would you approach this problem?
I hope you enjoy using the data and I'd love to hear your thoughts on how this type of analysis could be developed further. Happy number crunching!
The author's views are entirely their own (excluding the unlikely event of hypnosis) and may not always reflect the views of Moz.


Comments
Please keep your comments TAGFEE by following the community etiquette
Comments are closed. Got a burning question? Head to our Q&A section to start a new conversation.