
Enhanced Reporting Now Available in Moz Local
Editor's note: We continue to add new features to Moz Local every year. For a current feature list, see: https://moz.rankious.com/_moz/help/guides/local/local-dashboard.
As we approach Moz Local's first birthday—just over six weeks away—I'm excited to share with you our second major feature release since launch!
For those of you who are already managing your local search listings through Moz Local, this feature is available as of today for all accounts. For those of you who aren't yet customers, we hope this release provides a few more reasons to sign up (if you're curious to see what it looks like, you can check your local listing for free).
Read on for more detailed information about what we're releasing and why we're so excited about these new features.
New Dashboard Metrics
Listing Reach
Obviously local search is an incredibly complex discipline, and one of the hardest things for non-experts to understand (most of your clients and bosses, I'm guessing?) is the dramatic impact that the primary aggregators can have on the health and visibility of your listings. We hope that this metric helps explain the value of the data aggregators via Moz Local.
Listing Reach is our indirect representation of how far the data aggregators have spread your listings across the local ecosystem, based on the number of results returned for exact-match searches of your NAP. For more information about this metric, head on over to our Help Hub.
Percentage accuracy on each site in the Moz Local network
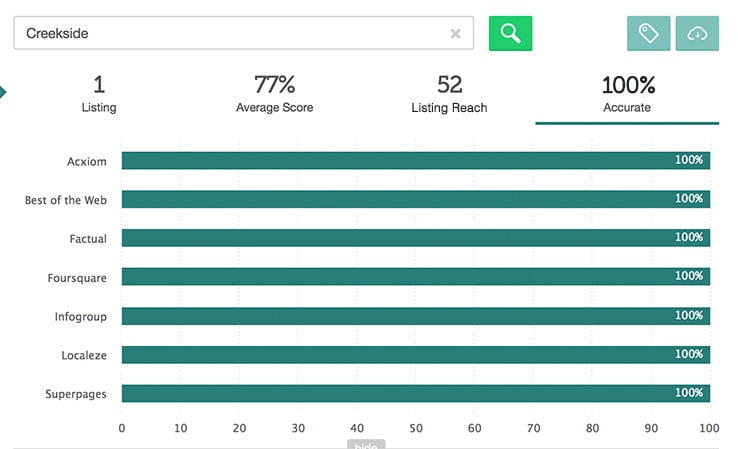
While these metrics have always been available at the individual location level (and will continue to be), you can now view them right from your dashboard, and <spoiler alert> across multiple locations at a time.
New Reporting Features
Metrics across multiple listings
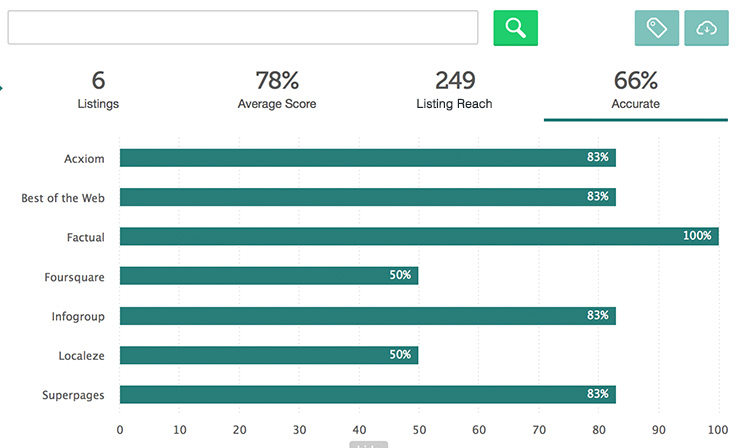
Percentage accuracy is not the only metric that's available across multiple listings; average score and aggregate listing reach are also enabled by default for whatever locations are in view on your dashboard.
Labeling of listings
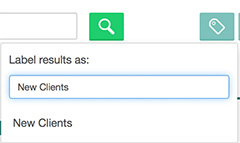
If you're managing multiple clients, or work at a large brand with multiple locations, though, you probably want to pick and choose the ones whose metrics you want to roll-up. You can now add labels to each listing that you manage, for easy slicing and dicing.
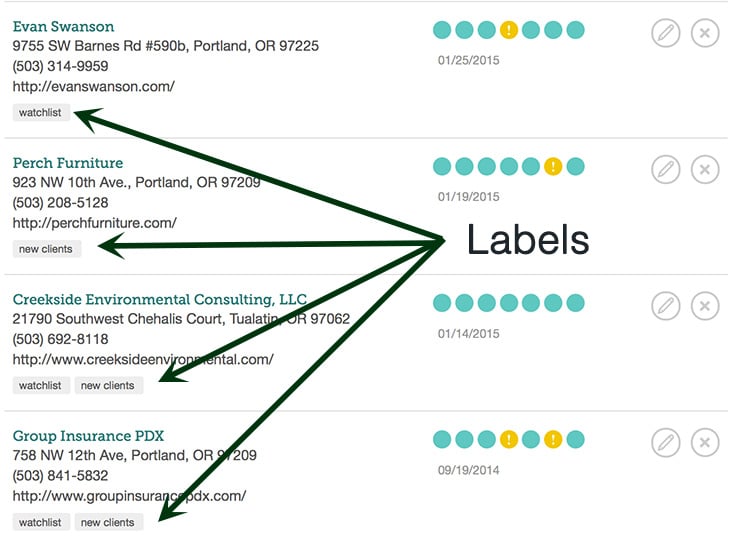

Our labels work similarly to Gmail, which we hope will make them intuitive to use. Once you add one or more labels, they'll start to appear as presets within your sidebar. Naming conventions are totally flexible, so you can segment your locations however you'd like.
You're just one click away from a roll-up report for all locations with a given label.
Enhanced search operators

To make the job of labeling locations easier for you, we've also added some additional search operators to make your lives easier. The full list of supported operators is below:
- label
- store
- name
- phone
- street
- unit
- state
- zip
- url
You can use these operators to pull up instantly any location you're managing (and of course, view metrics for that specific listing).
Metrics over time
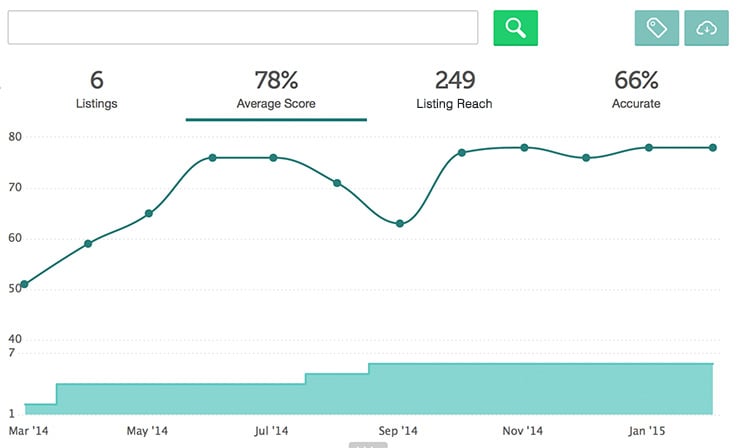
Two metrics are also now visible over time: average score and aggregate listing reach. One of the primary requests we've heard from agency owners and practitioners over the last several months is the need to demonstrate the value of your efforts to your clients, and we hope that graphs like the one below will help you do just that.

In September 2014, you may notice a stairstep in the shaded area at the bottom of the report, and a corresponding dip in the line graph above.
The shaded area represents total locations under management in a given month. Our goal in showing your metrics over time in the context of the number of managed locations is to explain anomalies in the graph like the dip above. In my specific case, I added a mortgage broker friend's location in September who was just getting started with his Local SEO campaign—meaning his Listing Score was literally 0 prior to starting with Moz Local.
Those of you who phase in clients over time will likely see similar anomalies in your line graphs, so we hope that this representation helps prevent unnecessary panicking :).
Upcoming Enhancements
We're definitely not stopping here.
Later this spring, we'll be rolling out the ability to export metrics from your dashboard for use in your own Excel reports, a PDF report generation feature, and a more streamlined Foursquare validation process, among other improvements. We're growing our engineering team rapidly and will release these as soon as we can!
Check It Out for Yourself
As I said in the intro, this feature is available for all existing customers today, so just head on over to your dashboard. And if you're not yet a customer, we hope you soon will be.
Along with yours truly, fellow Mozzers from our product, engineering and account teams will be available for demos throughout the day on Saturday at #LocalUp, so don't be a stranger. We're looking forward to speaking with many of you in Seattle!


Comments
Please keep your comments TAGFEE by following the community etiquette
Comments are closed. Got a burning question? Head to our Q&A section to start a new conversation.