
The Guide to US Census Data for Local SEO
The author's views are entirely their own (excluding the unlikely event of hypnosis) and may not always reflect the views of Moz.
As tax time nears in the United States, it’s hard not to wonder what exactly all that money is being spent on. Instead of getting into politics, I’d rather describe something our taxes do pay for and how it can help you plan an effective local SEO strategy.
During the daily grind, we can become accustomed to exclusive data available to us only through analytics platforms, Webmaster tools accounts, and other resources requiring a username, a password, and a mother's maiden name. This private-access mentality makes it easy to overlook that which is freely available to everyone – including our own Census. I’m Harris Schachter (you might know me better as OptimizePrime) and I'd like to show you not what you can do for your country, but what your country can do for you.

Using Census Data When Planning Local Strategy
During the planning phase of a local strategy, you need to identify which specific localities will serve you best, whether it be local content, social media, community engagement (geographic community & company community), on-site optimization, off-site citation building, link building, or anything else that goes into local SEO.
By using census data, these viable hyper-local markets can be identified before you even publish a single tweet. You can plan micro-campaigns designed to match each of the various cities, counties, towns, or even city blocks in your selected location. This type of analysis is particularly important when considering where to open a new brick-and-mortar establishment.
Demographic data can guide everything from the language and reading level of your content, to the methods by which it should be distributed. Distinct personas for each of the geographic components can be made to help you visualize the potential customers within them. Once armed with this information, local strategies (including everything you are going to learn from GetListed+SEOmoz) can be applied with laser precision.
You can spend hours on Census.gov exploring the myriad databases and tables. It can be overwhelming, so I’ll just demonstrate three of the most useful resources. If you’re an international reader, let this guide serve to motivate you to seek out what is available through your government.
Since it’s been cold lately, and Richmond has as enough plaid and square glasses to rival Seattle, I’ll use hipster snow boots as my example of a locally marketable product, targeting the 20-24 age groups. I’ll look for viable hyper-local markets in the Richmond area since that is where I live, and do most of my local SEO here at Dynamic Web Solutions. I’ll go through each of the three Census tools using this scenario.
1. Interactive Population Map
First is the Interactive Population Map. With this interactive map, you’re able to utilize population data at the most granular views. Currently the data is for 2010, but if you suspect a large population shift since the last data collection you can use proportions instead of volumes to make your observations. The image below shows counties, but you can view data at the following levels (from widest to most specific): national, Indian reservations, congressional districts, counties/municipalities, subdivisions, places, census tracts, census block groups, and census blocks (basically city blocks).

You can segment population data by age, race, ethnicity, and housing status, and compare these features to those of nearby locations.
How to use the Interactive Population Map:
- Head over to the map. Enter your location into the Find field, place your area of interest within the cross hairs, and use the on-screen controls to adjust the view and detail level.
- Choose any of the segmentation tabs, select a location, and click Compare.
- You can compare up to 4 locations to examine their demographics side by side. Once in the compare screen, you can flip between the tabs to view populations by age, race, ethnicity, or housing status for each of your chosen locations.
In my example, I chose Richmond City and the nearby counties of Henrico, Chesterfield, and Hanover. Since my hipster snow boots business isn’t concerned with any specific ethnicity, race, or housing status, I’ll flip over to age since I am primarily focused on the 20-24 age group.
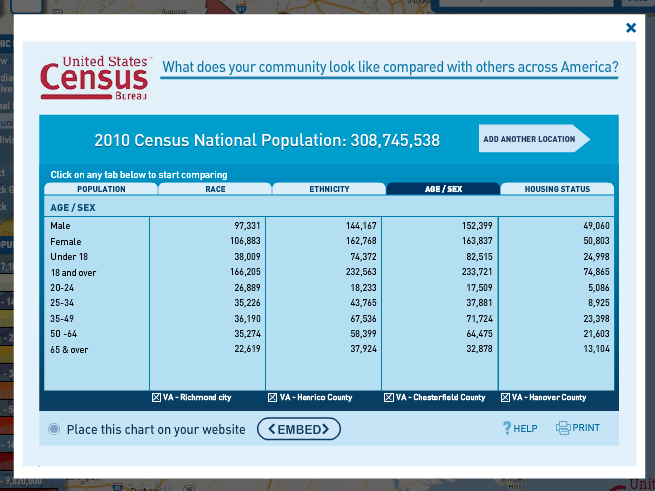
From the table, I can see the city of Richmond has more people in my target demographic (20-24) than the three neighboring counties. Interesting.
2. County and Business Demographics Interactive Map
Next up is the County and Business Demographics Interactive Map (or CBD Map). This is similar to the interactive population map, but provides more robust information in addition to population, race, ethnicity, age/sex, and housing status. This map layers in three business demographics: industries, business patterns, and raw counts of establishments per industry.
Industries are the general market classifications, such as Accommodation and Food Services, Construction, Manufacturing, Health Care, Real Estate, etc. Business patterns contain data on annual payroll, and employee counts (within a location or industry).
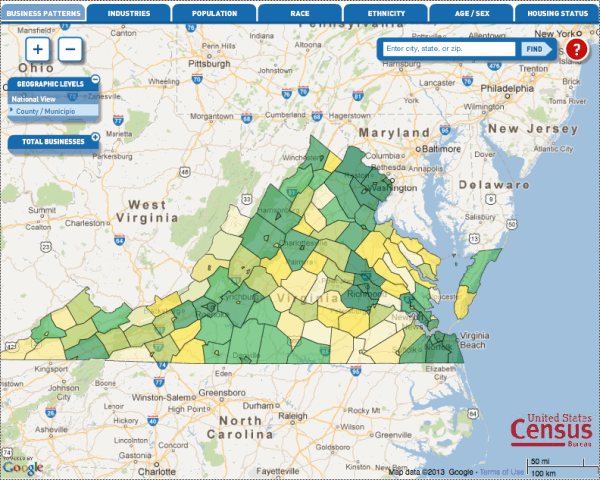
The CBD Map is limited to the county level, but the additional information makes it an essential tool to decide where to focus your marketing efforts. This map can display the number of establishments in each industry, in each location. The capability for local competitive analysis is priceless.
How to use the CBD Map:
- Head over to the map. Enter your city, state or zip code into the Find field. It should automatically switch to the County view on the left (under Geographic Levels). Choose any of the top demographic tabs – anyone will do for now.
- Select a location and click “Compare” at the bottom of the window.
- In the new window that appears, click “Add Topic” to choose your areas of interest.
- Once you have your topic areas chosen, go back to the map and select up to 4 more locations.
Going back to our cooler-than-snow snow boots business, I chose Retail Trade from Industries, 20-24 from Age/Sex, and Total Establishments from business patterns. In addition to Richmond City, I again picked the neighboring counties of Henrico, Chesterfield, and Hanover.
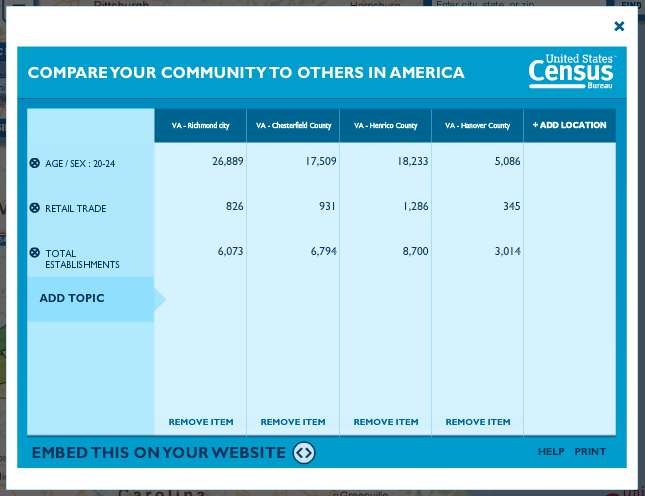
The goal while using the CBD map is to identify areas with large shares of your target demographic, but low business counts for your industry. This is a good indicator of areas with many potential customers, but low competition for them. Using the table, I can do some quick math to rank the four locations along these criteria. The comparison metric to use in this instance is number of (20-24 year old) people per retail trade establishment.
Richmond has 33, Chesterfield has 19, Henrico has 14, and Hanover has 15. Richmond has the greatest number of potential customers per establishment, suggesting comparatively low competition for retail store customers. Interesting.
3. US Economic Census
The final data table is the Economic Census within the American FactFinder collection. This is the most powerful database of the three, and also the most complicated. Data contained here includes everything the interactive maps do but at a much more granular level. Specifically, industries can be further broken down by individual product or service, and how many establishments offer them in any given area. This resource also contains a search bar- a familiar face in an unfamiliar environment.
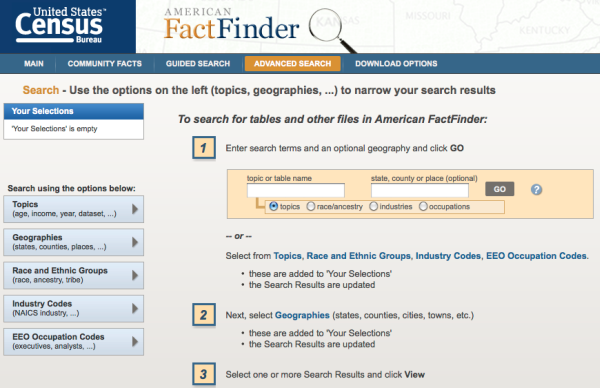
The FactFinder database is rather complex, so I’ll dive right into how to use it. Because this one is so detailed, the accessibility and recency of data is highly variable, so you may have more or less than what I’ve found.
How to use the Economic Census:
Step 1. Visit the American FactFinder database. Don’t be tempted to use the search bar just yet.
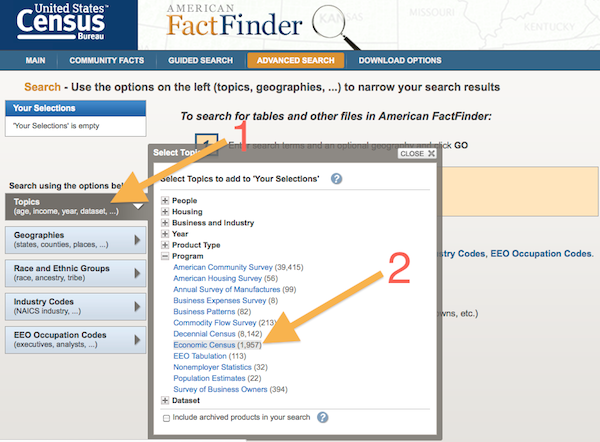
Step 2: Program
- Choose the Topics tab.
- Select “Economic Census.”
Step 3: Location
- Choose your location by selecting the Geographics tab. Use the “Geographic type” dropdown, and pick your level of detail.
- Select State from the next dropdown. I’ve selected County and Virginia respectively.
- Pick your actual locations from the next dropdown.
- Use the “Add to your selections” button to select your criteria.
- You’ll see the chosen options in the left sidebar under “Your Selections.”

Step 4: Industry
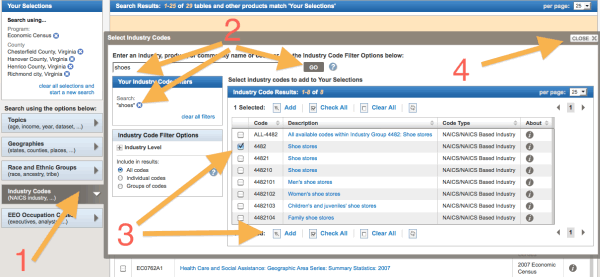
- Select your industry by finding the North American Industrial Classification System (NAICS) number under Industry Codes.
- Do this by using the search bar to find your business. This one is much more detailed than the industry selections of the Interactive Map, so try a few queries until you get a solid match.
- For my example, I first searched for “boots" with no luck. I then tried "shoes” and found the codes 4482 for “shoe stores.” Check off the applicable industry code and click “Add.”
- Close this window to reveal your search results.
Step 5: Database Results
- First, review your selections in the left sidebar.
- Check off the source most applicable to you, and make sure it is the most recent version.
- Select View.

Step 6: Data!
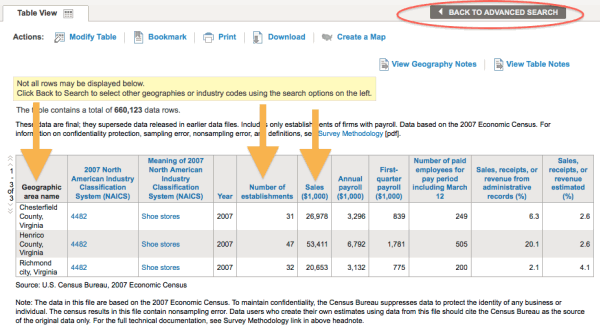
Finally, we’ve got the goods. First of all, I should warn you not to use your browser’s back button – all of your selections will be lost and the process starts over again. Instead, take note of the “Return to Advanced Search button.” Use this if you want to go back to the search options.
Check out the data columns. Specifically, the most important are: geographic area, number of establishments, and sales.
Data Collected From the Economic Census
Due to the sheer number of search options, every research endeavor will be different. My results had three of the four locations in a data table, and the most recent data is from 2007. Immediately, we can see Chesterfield had 31 shoe stores, Henrico had 47, and the city of Richmond had 32. This is another good indicator for the city of Richmond, since it shows a relatively low number of shoe stores, and we already know it has the greatest volume of our target demographic.
Now let’s look at the sales column for the total sales each location’s shoe stores generated. Using our county population data from earlier, we can calculate how much the average person spends on shoes (customer value) in each location. Keep in mind the population numbers are from 2010 while the sales figures here are from 2007, but hey, we're just making estimations.
Sales, Population, and Businesses
Divide the sales figures by the total county population. I found the average person in Richmond to be worth $101, in Henrico $174, and in Chesterfield $85. Of the three locations, the average Henrico resident spends the most on shoes. But what about our target demographics of 20-24 year olds?
For this calculation, we’ll apply the percent of target population within the total population, and apply it to sales for each location. Although this assumes the different age groups purchase shoes at the same rate, it will give us an estimated percent of sales contributed by our target demographic.
From the first analysis, we found the 20-24 year old group made up 13% of Richmond’s population, 6% of Henrico’s population, and 6% of Chesterfield’s population. After applying these percentages to total shoe sales, we find our target demographic spending $2.7M in Richmond, $3.2M in Henrico, and $1.6M in Chesterfield.
At this point, it might seem wiser to go after Henrico County, since the target demographic spends the most on shoes there, in total. Given the sheer amount of money spent on shoes in that county, I might consider a separate strategy to attract Henrico's business.
However, keep in mind Henrico has 47 shoes stores, while Richmond only has 32, and Chesterfield has 31. Taking this competitive information into account, we can compute the sales generated by the target demographic, for each store in each location. The data translates into $84k in sales per Richmond shoe store, $68k per Henrico store, and $52k per Chesterfield store. This suggests individual shoe stores in Richmond generate more sales from our target demographic than they do in the other two nearby counties. In-ter-est-ing.
Analysis Results
After three rounds of analysis, Richmond looks like the ideal place to set up a shoe store (especially one that sells supa-fly snow boots to young adults).
So, what have we learned from all this? From the data available, I’ve found:
- Richmond has a greater volume of people in the target demographic than neighboring counties.
- Richmond has more potential customers within the target demographic per retail store than neighboring counties.
- A shoe store in Richmond generates more sales from the target demographic than a shoe store in a neighboring county.
Apply the Insights
Now that you've identified the most viable business locations, it's time to incorporate these findings into local strategies. Go after these promising localities by gaining relevancy and ranking through a variety of methods, including:
- Hosting events in the chosen location to establish an audience.
- Building inbound links from sites which rank well in/for the target area (and be sure to diversify these links).
- Doing competitive analysis for the most visible websites in the locations uncovered by the analysis. Go through their backlink profiles for relevant links and try to attain them too.
- Encouraging customers to leave reviews, with specific attention to people in the targeted areas. Include the reviewer's location in the review itself to gain more trust and influence among the potential customers.
- Engaging with prospects in the identified locations through social media. Find them through various tools like Followerwonk's Twitter bio search and get the conversation going.
- Creating content specific to the viable locations. Dedicate a section of your blog for things to do and see in the area, why you like doing business there, interview citizens, government officials, or well known residents. Publishing content about the area can gain you exposure well before your visitors are even looking for your products or services. Once aware of your business, they'll likely keep you in mind at some point down the road.
- Optimizing your content with traditional on-site methodologies for the locations uncovered in the analysis (but don't overdo it).
- Developing press releases specifically for the target locations and distributing them to online sources like chambers of commerce, colleges and universities, local newspapers, free publications, etc.
- Considering mobile users and making sure your site delivers a satisfactory experience for people in the targeted areas. Local and mobile go hand in hand.
-
Finally (and possibly the most effective in the long-run) is to consider opening a physical store within the location.
- Claim all profiles and listings from data aggregators using consistent NAP citations.
- Use consistent NAP citations on the website itself.
- Consider including the name of the location in a brand name.
- Utilize rich snippets to take full advantage of your new location in the SERP
- Complete your Google+ Local page with proper categorization, and mentions of the location within the business description.
- Modify social media profiles to include this new location.
I encourage you to explore Census.gov, and subscribe to the Census RSS feed to make sure you don’t miss any of their interesting publications. They recently released mobile apps for the true geeks out there (I recommend the iPad app "America's Economy"). Also be sure to check out the data visualization gallery to learn something new or just to get some data vis inspiration.
So the next time a Census taker knocks on your door, answer it! You never know what type of product or business you'll be working with in the future, but chances are good that you'll have data for it.


Comments
Please keep your comments TAGFEE by following the community etiquette
Comments are closed. Got a burning question? Head to our Q&A section to start a new conversation.